
Corrosion Modeling Of Sweet Flowlines Part 2: Applications
Corrosion modeling can be performed very early in project development to estimate the feasibility of carbon steel use. It can also augment many different aspects of the design and operations of sweet flowlines. To achieve this, data used for corrosion modeling must be sourced and attributed to the task in question.
Input Data
Since corrosion modeling can be performed at many different times, some of the inputs can change. For sweet flowlines, some of the most important items are carbon dioxide (CO2) content (as mole percent or parts per million), pH, bicarbonate content, salinity, pressure, temperature and flow rates. Scaling, organic acids, wettability and other parameters are also sometimes included.
CO2 content is generally gathered from fluid samples taken during initial development or sampled directly off the test separator during production. CO2 corrosion models use CO2 partial pressure, and then correct this for the fugacity. pH, bicarbonate content, salinity (including chlorides) and organic acid content are taken from a formation water sample. The pH measured from this water sample is often referred to as “dead” because acid gases, which would lower the pH value, are no longer present when the sample is depressurized. This pH value should never be used for corrosion modeling. Of all the other inputs into corrosion modeling, pressure, temperature and flow rate are often modeled during design and initial construction because there is no good method of ensuring accurate values under flowing conditions. Therefore, any other pressures and temperatures require modeling to estimate. Some of the most common pressures and temperatures modeled are shut-in tubing pressure (SITP), flowing wellhead pressure (FWHP) and flowing wellhead temperature (FWHT). The temperature associated with SITP is most often sea floor temperature as this assumes the well has been shut in for some time.
FWHP and FWHT are often used for corrosion modeling of flowlines during design and construction, as they are generally the highest pressure and temperatures observed along its length. This is also true for a manifold where several wells can commingle. Use of these properties in corrosion modeling provides a more realistic assessment of flowline corrosion rates. While general physical property estimates can determine FWHP and FWHT, these often come from preliminary flow assurance modeling data, which are usually only representative of conditions for a specific time in the operational life.

Flow Assurance Modeling Data
Flow assurance modeling is undertaken to ensure optimum operation of flowlines by developing operating limits, liquid drop out and hold-up, slugging, etc., for production cases at different times in the operational life. This requires determining several of the inputs used for corrosion modeling, specifically pressure, temperature, and flow rate. Flow assurance modeling requires that these be determined for multiple different locations along the flowline and at different times in the operational life.
Pressure and temperature will change along the flowline. This is due to heat losses, elevation changes, head-loss, liquid hold-up, etc. Pressure, temperature and flow rate also change if additional fluids from other reservoirs are produced through the flowline, which can also cause a change in the CO2 content and formation waters present in the line. Pressure, temperature and flow rate will also change due to reservoir depletion or changes in arrival pressure. These changes in pressure, temperature and flow rate can affect the formation rate and stability of any protective films that may form, and thus can have an effect on modeled corrosion rates.
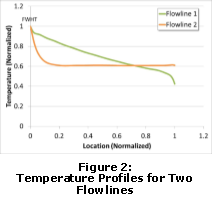
Figure 1 shows normalized pressure profiles for two different flowlines and Figure 2 shows normalized temperature profiles for the same flowlines. FWHP and FWHT are identified on both and are the highest pressures and temperatures in both flowlines.
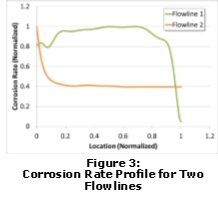
Locations with the highest pressures and temperatures are almost universally considered to provide the highest corrosion rates, but this is not always the case, as shown in Figure 3 for the two flowlines examined. Using the pressures and temperatures from flow assurance modeling, this assumption is confirmed for Flowline 2, but not Flowline 1. This is due to how protective films form and how stable they are at various temperatures.
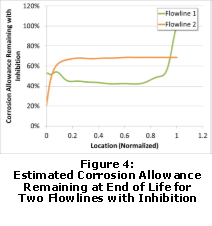
When design life and corrosion rates due to changes in operating conditions are included, a forecast of the flowline corrosion allowance at end of life can be evaluated as shown in Figure 4. While corrosion model outputs can be conservative and differ from one model to the other, the trends between specific locations in a flowline are generally consistent, and any values generated can be used to examine common assumptions made during design and development. This corrosion allowance forecast can also be updated periodically as additional flow assurance information is provided that reflects revised operating conditions, or following the gathering of in-service inspection data.
Benefits Identified
Examination of predicted trends for the end of life can provide some interesting information that can be used during design and development. While any full life corrosion rates or wall loss assessments are estimates, this information can be helpful in corrosion management plan development during design and construction as well as while in operation.
During Design and Construction
Chemical Inhibition Requirements - Initial optimization of the corrosion allowance and chemical inhibition requirements can be evaluated sufficiently early in design and development to determine the extent of the chemical testing program and any systems modifications that may be required if high corrosion rates are expected.
Wall loss for riser fatigue calculations can be estimated - While typically this is an assigned value, use of corrosion modeling with flow assurance data can provide some assurance to the validity of assumed values and permit modifications if required.
Development of key performance indicators (KPI) - Corrosion coupons at the topsides manifold may or may not be indicative of corrosion rates in the flowline. Corrosion modeling with flow assurance data allows the KPIs to be adjusted based on comparative corrosion rates between locations.
During Operations
General locations in the flowline that can experience increased wall loss due to corrosion can be identified. This can also help with understanding and interpreting the results from in-line inspection (ILI) tools.
Modifications to the chemical inhibition program. With periodic flow assurance data updates and corrosion monitoring results for calibration, modifications to the chemical inhibition program can be evaluated later in life. Revised flow assurance data is combined with corrosion modeling and then calibrated with corrosion monitoring to update the corrosion allowance forecast. This can then be evaluated against corrosion inhibitor effectiveness (availability x efficiency) to determine any revised corrosion inhibitor delivery requirements.
Conclusion
While the primary purpose of corrosion modeling is to determine if carbon steel is feasible for use, results can be extrapolated to better predict trends that can prevail over the operational life of a flowline. Data from flow assurance modeling is used to achieve this by evaluating individual locations along the length of a flowline and at different times in the operations life. This can provide a good check on assumptions made during design and construction. During operation, this information can also help understand corrosion issues in the flowline and provide a basis for better optimization of corrosion control programs.