
PWV Barrier Leak Test Acceptance Criteria Calculations
This GATEKEEPER discusses an effective subsea tree PWV (USV) leak test method. The test can be done quickly – entire test time is about 15 minutes, including the 5 minute monitoring time. More importantly, the test gives repeatable, unambiguous results that are easy to interpret and it can be done easily during any well shutdown.
REGULATORY REQUIREMENTS
The following are the regulatory requirements in the GoM for USV leak testing:
Quarterly testing, not to exceed 120 days.
Allowable leak rate of 400 cc per minute of liquid or 15 standard cubic feet (scf) per minute of gas.
PROBLEMS WITH TYPICAL TESTING METHODS
Several approaches have been taken to test PWVs. These involve either a) trapping pressure in a small, closed-volume cavity upstream of the PWV and monitoring pressure drop in that volume or b) creating a closed-volume cavity downstream of the PWV and monitoring pressure increase. There are several issues with these methods:
The cavity is often small. Any leakage will cause a large pressure change, especially if it is liquid filled.
One cannot always be sure what fluid is trapped (oil, water, gas, multi-phase). The test results can vary dramatically with the type of fluid trapped.
There is more than one valve creating the closed-volume cavity, any of which might be leaking.
Decreasing temperature may cause a significant pressure decrease.
PWV BARRIER TEST METHODOLOGY OVERVIEW
The PWV Barrier Test described here indirectly measures the leak rate exiting a confined volume formed by the closed PMV, PWV, XOV and the methanol distribution system (Figure 1). By including the volume of the methanol system we solve three of the above problems:
The trapped volume is greatly increased.
It is likely that methanol will be the fluid leaking through the PWV and it can be shown that the actual fluid leaking is not important because of the large volume of the system.
Changes in tree temperature will have very little effect on pressure because most of the system volume (the volume of methanol in the umbilical) is at ambient temperature.
The test directly measures the pressure change over the test duration, generally 5 minutes. Interpretation methodology calculates the mass rate of change for the confined umbilical volume associated with the observed pressure rate change and then, based on the density of methanol, calculates a volume rate change for the fluid exiting the confined volume.
Figure 1 shows the valves that are closed to confine the volume of the methanol distribution system (topsides tubing, umbilical, subsea distribution system, and tree tubing) and the treebore between the PMV, PWV and XOV for testing the PWV. Note that the methanol injection valves (MIVs) for all other wells served by the methanol distribution system are to be closed. Additionally, the PCV, FLIV and one or more manifold valves (MVs) are required to be open for this test in order to provide a leak path downstream of the PWV.

The PWV Barrier Test attributes all leakage exiting from the confined volume to be leaking through the PWV, although part of the leakage may occur through the PMV, XOV, topsides umbilical line XV, and other tree MIVs. Where the apparent PWV leakage exceeds the maximum allowable volume of 400 cc/min, the PWV and other valves will need to be individually tested using different technique(s) to measure leakage through these other valves, which is outside the scope of this GATEKEEPER.
The PWV Barrier test is conducted as follows:

TEST INTERPRETATION
After the methanol distribution system pressure decline rate has stabilized, as measured by the topsides or subsea tree pressure transmitters, a decline rate (ΔPressure / ΔTime) for the methanol distribution system is established and the total pressure decline is confirmed to be less than 500 psi.
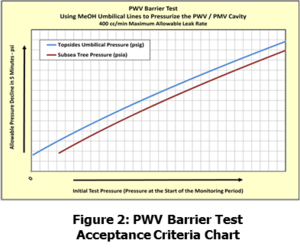
The observed pressure decline rate is compared to an allowable pressure decline rate Chart (and/or Table) for the wells served by the methanol distribution system, which has been developed for a 400 cc/min leak rate as shown in Figure 2. If the observed leak rate is less than or equal to the 400 cc/min leak rate for the methanol distribution system pressure at the start of the monitoring period, then the PWV has been tested successfully.
Charts and tables may also be provided where the Operator chooses to document an observed leak rate instead of a PASS/FAIL result for the PWV Barrier Test.
LEAK RATE MEASUREMENT METHODOLOGY
The leak rate through the PWV is indirectly measured by using an observed pressure decline rate (ΔPressure / ΔTime) to infer a volumetric leak rate (ΔVolume / ΔTime).
Methanol is compressible and the tubing that comprises the methanol distribution system is also expandable with increased pressure, so that the mass of methanol contained in the methanol distribution system can be determined for any pressure. Knowing the pressure at the start time and the end time of the test monitoring period permits the change of methanol mass to be calculated for these two times and, therefore, the mass rate (ΔMass / ΔTime) to be determined for any pressure decline rate (ΔPressure / ΔTime). Using the density of methanol, the leak rate (ΔVolume / ΔTime) is determined.
The Acceptance Criteria Chart/Table is developed for each methanol umbilical line in the field. Where a methanol umbilical line services multiple wells, the same chart (and table) is used for all of the wells serviced. The plot is determined by calculating the mass of methanol in the umbilical as a function of pressure given the following:
Topsides, umbilical, and subsea distribution system geometry and material parameters (tubing ID, OD, length, elevation profile, material, Young’s Modulus, Poisson’s Ratio, and coefficient of thermal expansion)
Ambient temperature profile
Fluid density as a function of pressure and temperature for the fluid contained in the methanol distribution system (pure methanol or wetted methanol).
Or the plot may be determined experimentally as follows:
Close the tree MIVs to isolate the methanol distribution system.
Use a methanol pump to increase the methanol system pressure to the maximum safe operating pressure.
Monitor topsides pressure and assure that the methanol distribution system pressure does not decline, indicating that the methanol distribution system is substantially leak tight.
Monitor subsea pressure if a pressure transducer is available. Note that a check valve at the methanol injection point means that tree pressure cannot be used on decreasing pressure.
Using a calibrated metal container (equipped with a grounding strap), vent the umbilical methanol line in pressure steps and measure the stabilized topsides and subsea pressures corresponding to the volume of methanol vented for each step. Note: this may be a significant volume.
Re-pressurize the methanol line and repeat steps 4 and 5 as needed to confirm and normalize the data.
Use the data to develop a ΔVolume / ΔPressureTopsides and ΔVolume / ΔPressureSubsea relationships.
Note that even if the experimental method is used, it is important to perform the calculation method first. The volume of methanol vented for a long subsea tieback will be large (many gallons) and the procedure needs to be able to accommodate that volume.
