
Introduction To Layer Of Protection Analysis (LOPA)
Is it safe enough? This can be a difficult question. Level of Protection Analysis (LOPA) is a structured method that yields a defendable answer to that question.
The Basis
The average 30-year-old has about a 1/1000 (10-3) probability of dying in this year (much of that due to automobile risk). Even though many people are surprised when they first hear this number, it is a level of risk that we implicitly accept.
Suppose that you were to learn that your odds of being killed on the job is 1/100 (10-2), ten times higher. You will likely be upset and may insist on improvements.
Fortunately, just the opposite is the case in most oil and gas operations. Companies that explicitly set a target seek to be at least an order of magnitude safer than the world at large (10-4). LOPA provides a consistent basis for judging whether there are sufficient independent protection layers against hazardous events to achieve the risk reduction required to achieve such an explicit target.

The Method
LOPA uses conservative, order of magnitude values for initiating event frequency, consequence severity and likelihood of failure of protective layers to approximate a risk level for any given scenario. In rigor, it falls between a typical risk matrix approach (as commonly used in HAZOPs) and a quantitative method (QRA). A LOPA is frequently performed after a HAZOP to further investigate significant findings.
The Standard Approach is:
Describe the accident scenario to be studied.
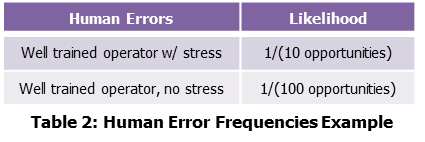
Identify the initiating event and determine the frequency or likelihood of the initiating event. See Table 1 and 2 for typical initiating event frequencies.
Identify the consequence level. The consequence severity is judged based on specified criteria. Table 3 is a simplified example.
Determine the Risk Reduction Requirement via a Calibrated Risk Matrix. Figure 1 is an example matrix.
Identify the Independent Protection Layers (IPLs), estimate the probability of failure on demand (PFD) of each IPL and mathematically combine the IPLs. See Table 4 for typical IPL PFDs.
Compare the combined risk reduction effectiveness of all identified IPLs with the Required Risk Reduction to determine if additional risk reduction is required.

Risk Reduction Matrix
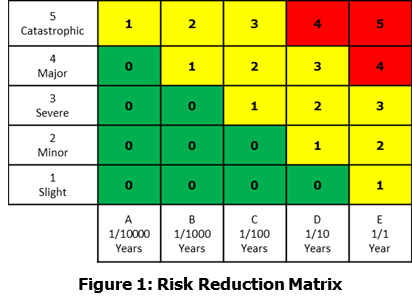
Figure 1 is a section of an example risk reduction matrix. The typical red, yellow, green color-coding is retained on this example, but the important feature is the numbers in the cells. These are order of magnitude risk reduction requirements.
This is a “10-4 matrix”. The entry of a ‘0’ in row 4 - column A indicates that no further risk reduction is required for a scenario featuring a major consequence (single fatality) estimated to occur at a frequency no greater than 1/10000 years. (Recall from the discussion earlier that this is 1 order of magnitude safer than the world at large.)
This matrix has the agreeable property that moving one row or column in any direction changes the severity or frequency by 1 order of magnitude. Hence, having established the basis ‘0’ in row 4 – column A, it is a simple task to complete the rest of the entries. Move one column to the right – add 1. Move one row up – add 1.

Safety Integrity Level (SIL)
In practice, the LOPA is typically used to determine the required reliability of Safety Instrumented Functions (SIFs). The accepted reliability standard for a SIF is the Safety Integrity level (SIL) rating which is a measure of the function’s PFD. Table 5 defines SIL levels.
For example, a typical Pressure Safety Valve (PSV) is expected to fail to open in 1/100 to 1/1000 tries. Hence, a PSV is assigned a SIL rating of 2.
Example:Figure 2 shows an Inlet Separator taking feed from a flowline. We will evaluate the required SIL rating of the PSHH function. The HAZOP team identified two overpressure scenarios for this vessel:
Catastrophic failure of the ceramic internals of the choke PCV-1.
Failure closed of the valve PV-1

Since the maximum flowline pressure, 2200 psig, is more than twice the vessel design pressure, 900 psig, this could be a very serious event. At this overpressure vessel deformation and serious flange leaks are likely and catastrophic vessel failure is possible, especially if the vessel is aged and corroded. LOPA processes typically provide guidance for selection for the consequence severity. For our purposes here, let’s say that the LOPA team selects a consequence rating of 5 (catastrophic event).
Fortunately, catastrophic choke failure is a rare event. From Table 1 we estimate a frequency of 1/100 years. A category 5 event (Catastrophic) predicted to occur 1/100 years requires 3 orders of magnitude risk reduction per the risk matrix (Figure 1). IPLs must provide a SIL 3 level of protection.
Two IPLs are identified:
The PSV with a SIL of 2
The pressure control loop with an effective SIL of 1.
These two together provide the necessary risk reduction target of SIL 3 with no residual demand on the PSHH. But in this case we would likely elect not to claim the process control loop and instead assign a required SIL rating of 1 to the PSHH SIF.
In general we would like to avoid explicitly using process control functions as IPLs. Claiming them as IPLs adds a level of required design verification and testing to the control loop design and operation.
So for scenario 1 we have identified a target SIL of 1 for the PSHH. A similar exercise would be conducted for scenario 2 which may yield a different SIL target for the PSHH SIF.
IPLs vs. Safeguards
HAZOPs identify multiple safeguards. These will not all count as IPLs under LOPA rules. In order to be considered an IPL, a protective function must be:
Effective in preventing the consequence when it functions as designed. Can detect the condition, respond in time to take corrective action, and has adequate capacity.
Independent of the initiating event.
Independent of any other IPL for which credit has already been taken.
Auditable and testable.
Determining PFDs of SIFs
In order to establish the SIL rating of a SIF, the failure probabilities of the individual components of the SIF must be statistically combined and a testing frequency established. The testing frequency is an important consideration. Conceptually speaking, any device can meet any SIL rating if you test it frequently enough. Consider this extreme example – an instrument expected to fail once per week, will yield a pretty low PFD if you test it once per day.
Determining the SIL rating of SIFs is outside the scope of this GATEKEEPER. The discussion below suggests general guidance on what is practical.
Achieving SIL 1: A single safety switch actuating a single SDV can easily meet SIL 1 with a reasonable testing schedule.
Achieving SIL 2: Achieving SIL 2 may require multiple sensing devices in a voting arrangement such as 2 oo 3 voting and multiple SDVs in series. Expert guidance is required.
Achieving SIL 3: SIL 3 SIFs are very rare in the oil patch. Don’t go there!
Conclusion
LOPA is a relatively new approach to process risk assessment. It has gained wide acceptance because it is a structure method, is relatively easy to use, and is sufficiently rigorous for most process risk assessment. It is commonly used to determine the required reliability (PFD) of SIFs. It is also a useful tool for risk assessment in HAZOPs.